

Finding the perfect house with amazing views, near a great school, and with all the necessary features, can be a dream come true. However, your dream house can quickly become a nightmare if you end up with bad neighbours. You could door knock the neighbours and ask about their criminal history, but there is an easier way to find out if you are moving into a bad area or a nightmare street. The Queensland Crime Map from the Queensland Police Service can help.
Vet Your New Neighbours With the Queensland Crime Map
You have done your due diligence by driving the neighbourhood at night, looking at nearby houses for prominent signs of meth labs and drug use, but need more reassurance? The Queensland Crime map is your new best friend with all the “tea” in the neighbourhood. This interactive map provides all the information you need on crimes that have been committed in the suburb in the last two years. All crimes, including homicide, are listed, with the exception of sex crimes. This protects victims that may still reside there.
What Can the Queensland Crime Map Tell Me?
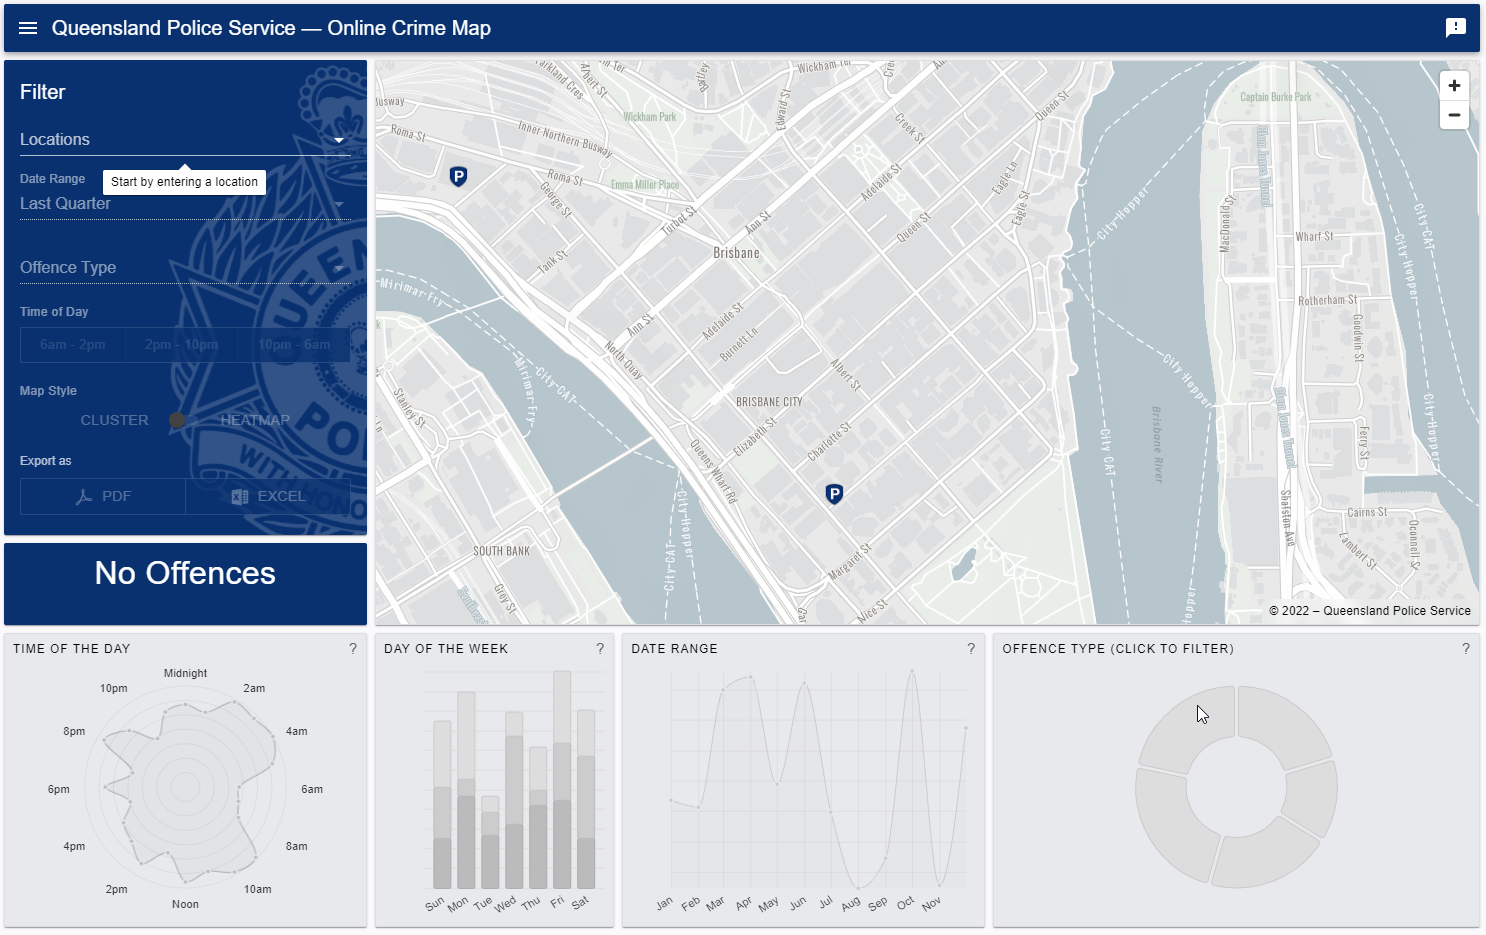 On the left of the map are the selection drop-downs where you select your suburb, the time period you want to research, and the offense type. For example, want to know if there is a drug entrepreneur-either cook or retail-living in the area? Enter the suburb, select one year and drug offences. You will see that yellow circles with numbers appear. If there is a cluster of offences in the street you are considering, there’s your answer.
The Queensland Crime Map Can Pin Point Red Flags When Considering Purchasing A New Home
Perhaps there is a hotel or club near the house. Do the same but replace the drug offences with liquor (excl. drunkenness). You can add multiple offense types, so add assaults and drug offences, and the numbers will appear in yellow. Specific offenses are listed when you hover your mouse over these numbers.
You expect to see some criminal activity, but may want to know what days and times are the worst. At the bottom of the screen, you can see small boxes showing you the peak times, days, months, and offense-type pie chart. Hover over these to pinpoint specific information. This convenient tool may show that drug and alcohol offences are all committed at 2 a.m. far away from your potential home. It may also save you the heartache of discovering that sweet old lady across the road who waved during the Open Inspection is just a cover for her son’s other activities.
Use the Queensland Crime Map correctly to avoid the disaster of moving into a disruptive neighbourhood, and little to no resale value on a beautiful home in a nightmare location.
This map is an asset to you when purchasing, but be mindful that when selling, your potential purchaser may know about the map too. Do your homework, sit at home and let the map do the hard work for you.


